I’ll be returning to posting regular ML topics shortly, got caught up in a lot of things at once. Have a couple posts on Andrew Left and prediction markets in the pipeline. Once again, I’ll note that you can get these “live” by signing up for the newsletter here:
I’ve added a “stocks to watch” section as well, so there’s some potential stuff to look at on market open. Here was the blurb from Thursday night:
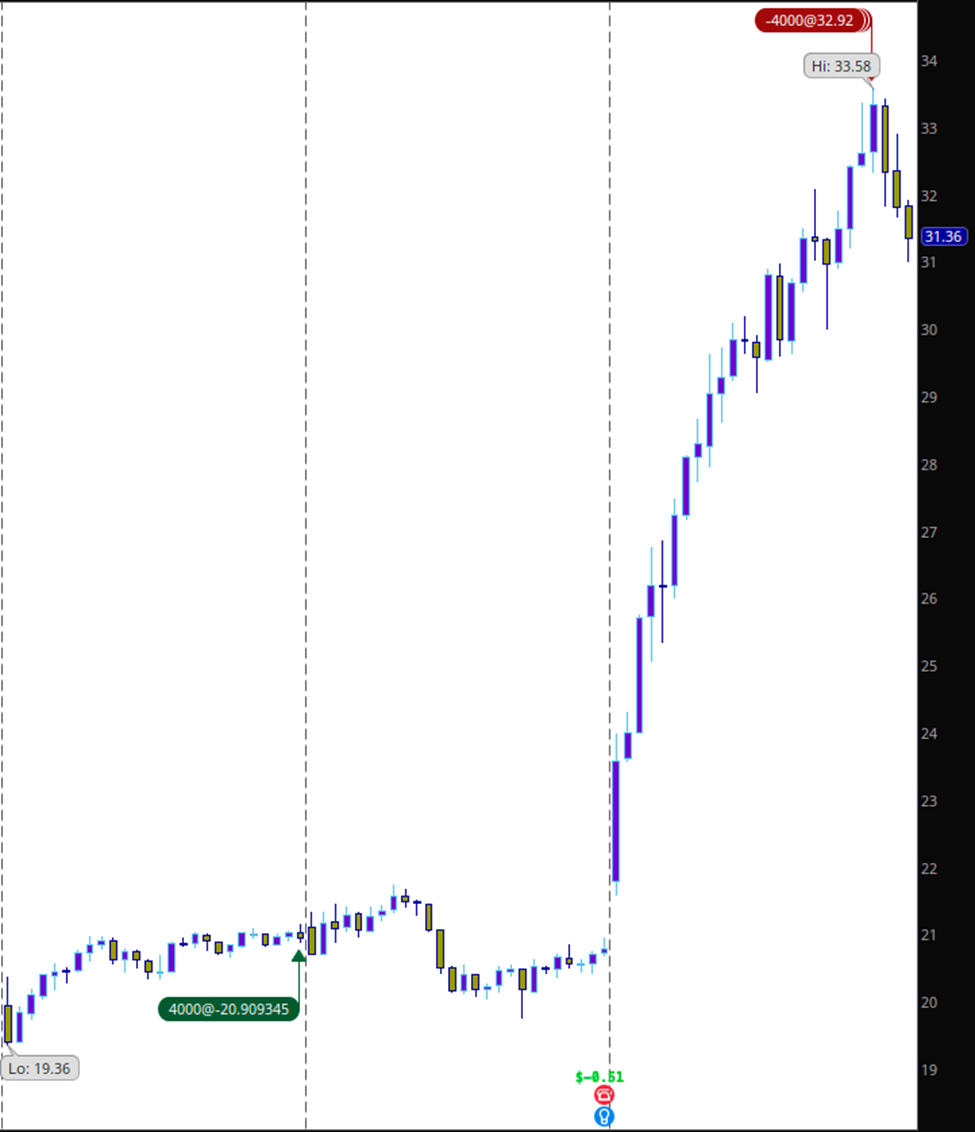
Given the breakout day on NQ, I have been watching GOOGL lag behind and think it “catches up” soon (looking for 164+ to retrace to 170). Much like orderflow “nodes”, in low volume intraday drift, the index acts as sort of a “magnet” as passive arb between basket and stock “enforces” beta (more to come on this later.) Today’s a good example — as volume dies down, the “underperforming” element (as long as it’s of sufficient weight) tends to converge to the “magnet”. Usually, this isn’t tradable, but it’s good to keep in mind if you’re expecting a move and volume dies off — this is the #1 killer of option premium intraday.
I took this long myself live and closed when it crossed over — trade completed.
This post is heavily drawn from “Moth Liquidity”. I’ve added some stuff to account for Friday’s market movement as well, to make this its own independent post.
On: runners, fundamental investors, catalysts, ASTS
As recently as last week, I was talking about the age-old adage “let your winners run.” But how far exactly should we let them run, lest we become Wil E Coyote and fly off a cliff?
Tuesday, in my “stocks to watch”, I didn’t put ASTS because I figured everyone already knew about this thing. Well, clearly, someone didn’t get the memo, with the post-ER move coming in at a whopping 50% on the day, closing above 30 after touching 20 on Wednesday. The interesting part was, this thing opened at 23 or so — most of the move came during the trading day, as it just ticked up and up as volume exploded.
It’s important to remember why ER matters in the first place — from “Moth Liquidity”:
…the trading community sometimes glosses over the biggest driver of inflows into the market — investment. While “funnymentals” don’t really help develop trading ideas, it’s important to understand the motivations that drive asset allocation and the fuel that contributes to the longer term upward bias of markets.
The vast majority of money that moves in and around the market is based on the philosophy that whatever is invested in will create future cash flow rewarding current shareholders, who hold a right to their share of the output. When this money sloshes around, it creates market impact, which in turn creates trading opportunity. Note that these investors generally operate with a philosophy that they don’t want to react to day-to-day market movements. They are in it for the cash flow created over time and the movement in share price that will reflect that. So we want to focus on what will motivate them to decide that they want to demand liquidity and increase or downsize their positions.
Since these investors operate in sizes that trounce normal trading position sizes, having an idea of when they might start to shift positioning is very useful. Investors are not concerned with impacting the market to the scale of a couple percentage points, of course — their time horizon is much longer and the projected return compounds over time to many multiples of that — but obviously they’re not execution insensitive. What we’re concerned about is what will drive them to adjust their positioning and drive immediacy of market impact…
Predicting how investors will react and position to catalysts like earnings is some of what makes up event-based trading. We still want to utilize our core tools of assessing expectancy and managing risk, but where we assess the likelihood of which direction the price will move and the magnitude of it in reaction to the event.
With ASTS, the catalysts are a little different — the event, in this case, is a satellite launch, and ER was the last “real” time to announce a shift in the timeline. You can pretty much conclude that [Thursday’s] volume was a massive amount of short covering, in what may be the cleanest breakout in a stock I’ve ever seen — the sheer amount of stock flow crossing the spread as every dollar level was crossed is as clean as “bullish flow” gets. A bit of counterintuitive thinking — it’s much better to buy stocks at all-time highs than 52 week lows (e.g., highs beget more highs) — naturally, it makes sense that stocks that perform well continue to do so. Using this logic, we can work our way to why I would flatten such a runner on such a bullish day.
I originally intended to take a long term position over time in ASTS by legging in. Many, many people have been talking up this stock to me for months — I didn’t really pay attention until I got back from my summer travels, and realized that it was the real deal. (Of course, it had already run up a ton by then.) This, of course, meant that I was going to long shares — I wasn’t trying to time a specific move or trade around a catalyst. (Plus, IV is so elevated on the options already — the stock has 8x’d in the past few months — and due to [Thursday’s] move, vol actually went up rather than crushing, because, of course, the “true” catalyst is still a bit away.) When you trade shares, you essentially trade the risk of not timing the trade properly for the fact that you don’t get compensated for volatility on movement. (Hence “delta-one”, which options clearly aren’t.) So, a simple bit of deductive reasoning is useful — if I wouldn’t buy more at the current price, I’m going to look to flatten. After all, if I hold shares from 21 to 32 and then it retraces back to 29, what exactly did I gain for holding through the price movement, if I’m not going to add to my position? The prospect of long-term capital gains being 364 days away instead of 365?
While I am not a fan of “at least you came away with profit” logic,
sometimes you do have to accept that a massively outsized move can justify flattening and realizing some gains. “Realize gains in real life” is a motto of mine, specifically to avoid round-trip scenarios like this one from WSB the other day:
In both ASTS and indices [Thursday], you saw the rare occasion of vol rising as price went up throughout the day. Uncertainty, after all, is bi-directional, and in our prior discussion of vol curve dynamics, we note that shifts in implied volatility results in more reversals going forward. Nothing goes up forever, and sometimes “zooming out” by flattening your position and waiting for the next is the best trade to make.
Friday Postscript
Further evidence of the fact that this was a ludicrously technical move rather than a fundamental one is by looking at the comparable RKLB chart. I love tradingview in particular because it has the best overlay/zoom in+out functionality of any site for quick and dirty screenshots. (I don’t use charts on principle, that’s why my charts look like the LSU marketing department vomited over a white canvas Jackson Pollack style.)
If you had longed either ASTS or RKLB, by Friday close (before EOD volume kicking in again), it barely mattered which one you were long from a delta-one perspective. This was pretty foreseeable:
I talk about the 10 AM EST reversal a fair bit,
because it’s the point where “real flow” rather than opening price discovery while book depth builds starts to impact the market. Remember what I was saying about the index “magnet” from the beginning of the post? Well, single stocks realizing outsized volume from its norm act in the same way relative to the other comparable stocks in the same “basket”. (I call it the “liquidity suction”). The GOOGL long I mentioned at the beginning follows the index because indices have different liquidity and are the “vehicle” driving the passive complex — similarly, a single stock doing the flow is significantly more liquid than the comparables, so when that volume drifts off, they tend to converge. (Hence why I go on about “enforced beta” so often.) Here’s an excerpt from 2021’s Year in Review that delves into this more:
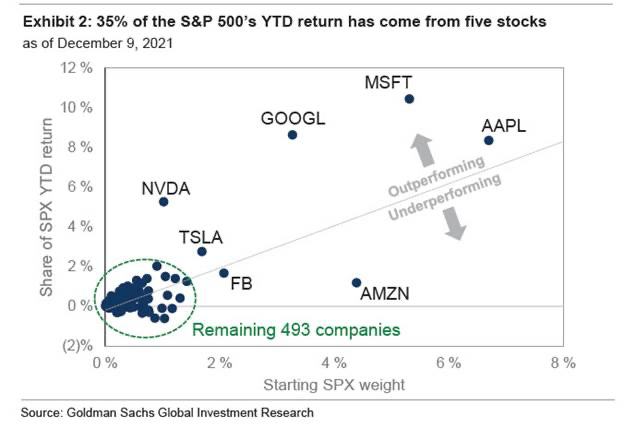
The Crowding Continues
Looking a bit deeper, has the market actually returned all that much this year? YTD we are up quite a lot, but most of the returns have come from a handful of stocks that are permabid by institutions along with individuals.
We can logically conclude that a sort of push-and-pull effect occurs: “real” flow goes into large caps, they rebalance as part of the ETFs they are in, “passive” flow goes into ETFs and drags the rest of the stocks up along with the large ones to a smaller extent.
The market regime has changed, but the “Newton’s third law” method of thinking only gets stronger and stronger. From the very first (!!) Malt Liquidity (11/30/2020):
It’s useful to look at financial markets from a standpoint similar to Newton’s Third Law - for every movement in a financial product, there is a product tied to it that will adjust accordingly (though not “equal and opposite” - there are far too many products built on top of products with non-linear relations for anything in finance to be this simplistic.)
As you can tell, I’ve been thinking about this for a long, long time, and it only gets reinforced more with increasing amounts of passivity. At the very least, it means I’ll have a lot more to keep writing about.
If you enjoyed this post, please consider forwarding the email or sharing the link.


